Candlestick Patterns#
Candlestick patterns are visual formations that signal potential price reversals or continuations.
Visual Reference: Common Candlestick Patterns#
Alt+Scroll zoom · Alt+Drag pan · Double-click reset
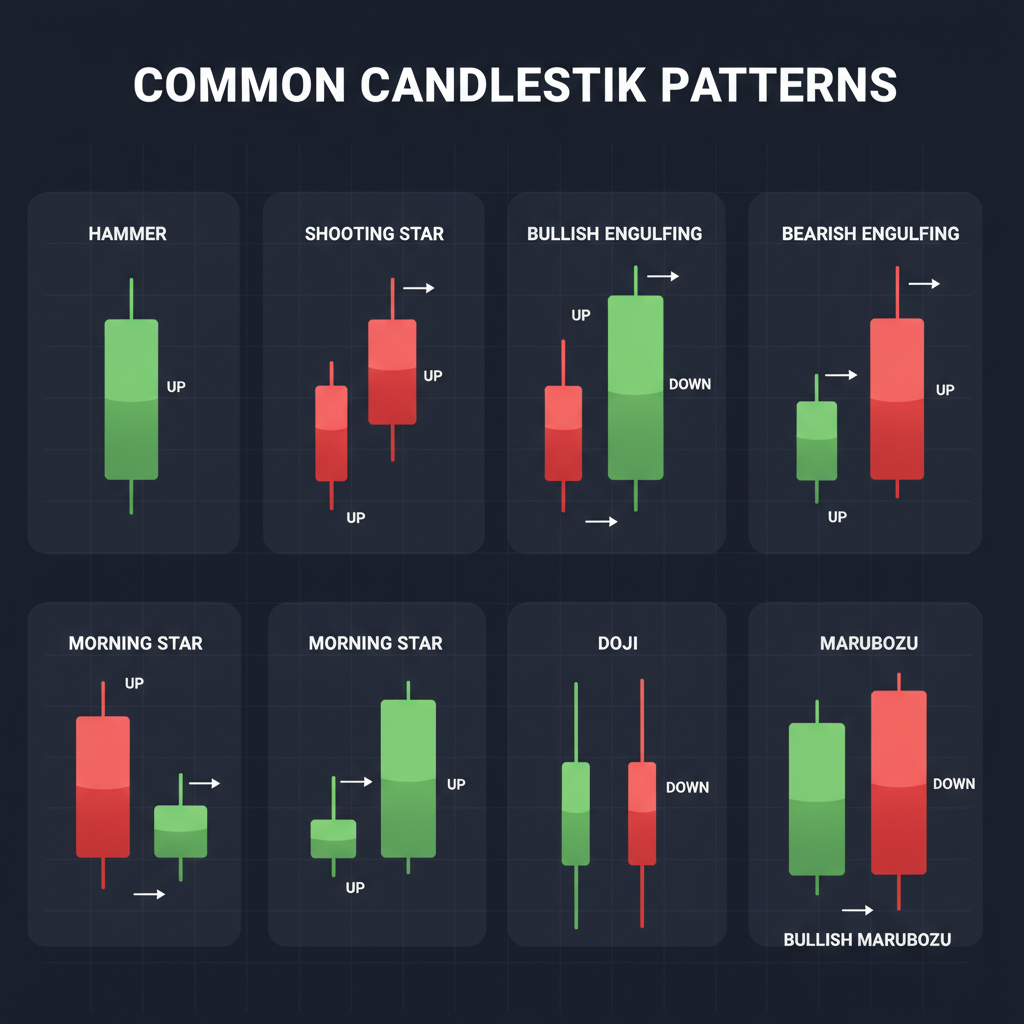
Common candlestick patterns - Hammer, Shooting Star, Engulfing, Morning Star, Doji, and Marubozu
Single Candle Patterns#
Doji#
- Open = Close (tiny or no body)
- Shows indecision between buyers and sellers
- Important at tops/bottoms of trends
Hammer / Hanging Man#
- Small body at the top, long lower shadow (2x+ body)
- Hammer (at bottom): Bullish reversal signal
- Hanging Man (at top): Bearish warning
Inverted Hammer / Shooting Star#
- Small body at bottom, long upper shadow
- Inverted Hammer (at bottom): Potential bullish reversal
- Shooting Star (at top): Strong bearish reversal
Marubozu#
- Full body, no shadows
- Green Marubozu: Strong bullish momentum
- Red Marubozu: Strong bearish momentum
Double Candle Patterns#
Bullish/Bearish Engulfing#
- Second candle completely engulfs the first
- Bullish: Red followed by larger Green
- Bearish: Green followed by larger Red
- Most reliable 2-candle pattern
Piercing Line / Dark Cloud Cover#
- Piercing Line (bullish): Red candle, then Green opens below low and closes above midpoint
- Dark Cloud (bearish): Green candle, then Red opens above high and closes below midpoint
Triple Candle Patterns#
Morning Star / Evening Star#
- Morning Star (bullish): Red candle, then small body (gap down), then Green candle
- Evening Star (bearish): Green candle, then small body (gap up), then Red candle
- Very reliable at key S/R levels
Three White Soldiers / Three Black Crows#
- Three consecutive strong candles in same direction
- Signals strong momentum
Tips for Using Candlestick Patterns#
- Context matters - patterns at S/R levels are more reliable
- Always wait for confirmation candle
- Higher timeframe patterns are more significant
- Combine with volume for confirmation
- Do not trade patterns in isolation - use with S/R and indicators